
Let’s get back to the sensitive question of IOF financials. In January I hoped that there might be some meaningful information shared after the IOF Joint meeting where finances was a surprise topic. Unfortunately, the slides of the strategy/finance presentation of the joint meeting were not published by the IOF despite some very positive vibes coming from that meeting. Only the formal minutes related to the meeting were published here and here.
The 2017 audited financial reports are probably already prepared, but we may have to wait for a long time before we see reliable numbers. Last year the audited accounts were not shared with member federations for 3 months. They were sent to members only after the Presidents’ Conference, maybe to avoid inconvenient questions on the conference.
In the meantime, there were bits and pieces of information shared by the IOF clearly with the intention to prop up confidence about the state of finances:
- The January Council meeting minutes (#187) stated that the IOF had a “a cash position of 157 TEUR at the end of year 2017” under Point 10.2
- In the same minutes under the same point it was stated that “preliminary financials showed a final result of approximately 16 TEUR”
- The message of the non-public January meeting was that “the IOF’s financial situation is stable and balanced” as reported for example by the German Federation’s web page based on the report of German delegates.
In this post I would like to show you why one has to take these pieces of seemingly positive information cautiously, especially when they come from an organisation with stretched financials. That’s why I referred to these as “smoke and mirrors” in the title. They give the feeling of an intention is to strengthen confidence, they sound good to people not familiar with the ins and outs of financial reports, but they give no guarantee that the actual financial performance was good or not.
I hope this discussion may also help some Council members (many of whom read this blog) to have a more meaningful discussion next weekend on the Council meeting in Belgium.
Cash position
A “cash position of 157 TEUR at the end of year 2017″ must be good news, mustn’t it? Yes, it is definitely better to have some cash on the bank account, but there is not much more one can say. In an earlier post I wrote about how the amount of cash in hand does not correlate with financial stability. One less familiar with finances may want to read that post first.
Here I will show the balance sheet development of the IOF over the past couple of years to illustrate the same point with hard data.
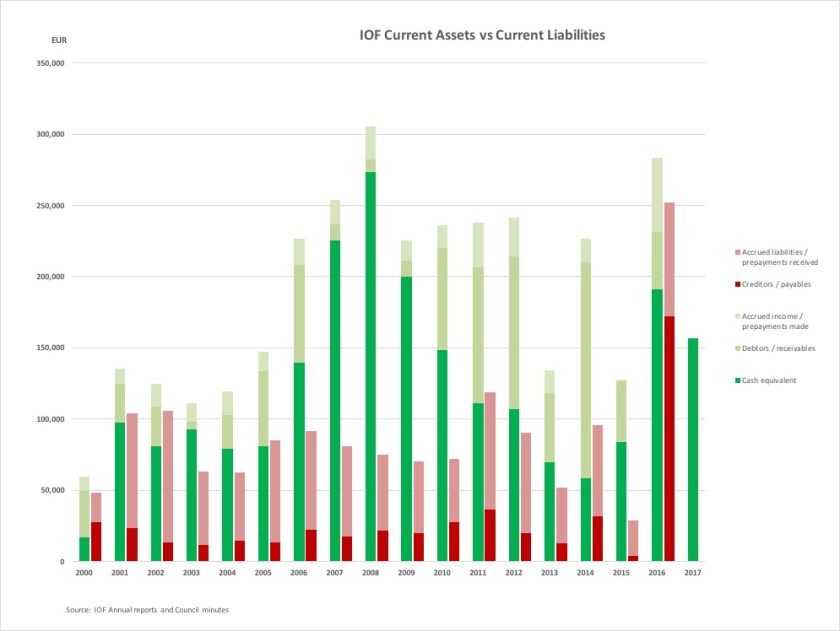
The above chart shows a simplified picture of the IOF balance sheet. Before we start to analyse it, I would like to explain the basics of accounting for the majority of readers less familiar with the black magic of financial reports.
Some accounting basics
The greenish column on the chart shows current assets (valuables the organisation has or expects from others) and the reddish one shows current liabilities (the obligations of the organisation owes to others). The above is an approximation of the cash-like assets and liabilities due within one year at the end of the calendar year. Missing are the long term assets (like computers and furniture) and the items in stock. In case of the IOF these carry little value and unlikely to have any material cash value.
- Full green is the actual cash the IOF had at the end of the year. One can see that since 2001 it has never dipped below €58,000
- Middle green shows debtors/receivables, the amount of monies the IOF has already invoiced, but not paid yet. These would typically include membership fees and sanction fees yet to be paid. For example at the end of 2014 this was an extra large amount due to the delayed payment from World Masters organised in November in Brazil.
- Light green represents the sum of the amount the IOF has pre-paid before using a service (unclear if there are any), and the services it has already performed, but not yet invoiced to others.
- Full red is the amount of unpaid invoices already received. It is striking to see the big jump in 2016 in this category.
- Middle red represents the sum of services already used, where no invoice was received, and advances received. The latter one is a direct boost to the cash at hand. Last time it was in 2011 when the IOF financial report separated these two items. In that year there were €68,000 advance payments received, so it can be a very substantial amount to boost the cash amount with unearned monies.
Stability considerations
When one scrutinizes finances, the key question is how cash compares to liabilities. It is a sad fact for traditional, law abiding organisations that it is much more likely that you have to pay your obligations, than others paying their obligations to you. It seems that the the IOF also had some unpaid invoices, including membership fees never received and the Brazilian debt of €16,000 after the WMOC in 2014. The latter one for example had to be converted into a 3 year long Latin American development program with not cash for the IOF (more on that in this post and in this document: 2016 – Acordo IOF CBO – Debt Agreement Original em inglês)
The prudent view is that the finances of an organisation are stable when the cash at hand (full green) exceeds all liabilities (total of the red and half red column) and there is still some left for unforeseen events. This was clearly the situation of the IOF between 2007 and 2010.
The financial situation gets iffy, when the total liabilities are comparable with cash at hand, like it was the case in periods between 2001 to 2005 and more recently between 2011 and 2013.
The financial situation gets really awkward when cash at hand is comparable with the amount of outstanding invoices, like in 2000 and 2016. It means that the only reason the organisation has cash is that they did not pay their invoices.
And finally, the financial situation is simply catastrophic when current assets do not cover current liabilities. Fortunately, this did not happen to the IOF since 2000, but in 2016 the gap between the two was smallest since 2000. Total current assets exceed liabilities only by 10% at the end of 2016.
Important to note that 2016 was also the only year since 2000 when liabilities exceeded the sum of cash plus receivables – a clear indication of the seriousness of the situation.
The value of information on cash only
With all this background, now we can evaluate how reassuring is that at the end of 2017 the IOF had €157,000 cash. The simple answer is: it is not reassuring at all. It is impossible to derive anything about the IOF’s financial stability in the absence of additional information on creditors, payables, accrued liabilities and prepayments received.
One may clearly see this also on the chart above: in 2016 the IOF showed the 4th largest cash position since 2000, but it was in the worst financial position during those 16 years. We have to wait with a proper evaluation until the full balance sheet of 2017 is published.
Profit for the year
The situation is similar with the apparently positive information of “preliminary financials showed a final result of approximately 16 TEUR”: it is definitely better to have a positive result than a negative one, but that’s where the good news ends in the absence of additional information.
The key point is that seeing only a profit figure, it is unclear how much of the revenue was actually received in cash, if it was received at all. For comparison, look at the 2014 results, the last year the IOF had a surplus. The €47,300 profit included the €16,000 Brazilian obligation discussed above that was never received by the IOF. Yet, it was part of the profit figure reported.
Again, we have to wait until we see the full financial report for 2017, including the changes in the balance sheet to be able to evaluate the results.
Good vibes in January
As discussed in my post in January, the presentation on finances to technical delegates to IOF commissions was a strange development. A presentation given to an audience that neither had the background, nor particular interest to get into finances.
As I heard from people who were present, the format was not particularly conducive for understanding details either. There were 20 or so slides presented on strategy and finance in 30 minutes, including a detailed spreadsheet showing over 20 lines of finances for 5 years. There were also some slides showing profit/loss calculation by areas and disciplines for the first time ever, but with no explanation on the allocation method used for general cost items.
Even experienced professionals would have no chance to comprehend anything meaningful from such a presentation. To give an analogy closer to orienteers: imagine that when there are concerns about mapping for a World Championships, the organisers give a presentation to non-mappers using slides showing full maps and some non-relevant details, while keep saying that mapping goes well.
Could anybody dispute such a reassuring presentation?
Old sceptics like me with experience in finances with distressed companies may have strange feelings. Management of companies in good standing would never discuss finances with non-professionals. But management of companies in distress is always keen to send messages of reassurance with no relevant detail. A more recent example of this was Monarch, Britain’s fifth largest airline that went bust on 2 October 2017. The CEO sent a cheery, reassuring email to staff urging them to ignore rumors about the financial situation of the company – only seven days before they went bust, resulting in the largest British peacetime repatriation of 110,000 passengers left overseas.
Let’s hope that the IOF financial report for 2017 gets published in the near future, and that the detailed numbers confirm the positive messages. Until then one has to be cautious and avoid overinterpreting pieces of information that do not show the full picture.
