
Probably you were also wondering where all the money collected mainly as fee/tax is going. Many people are guessing, but very few know the numbers. My feeling is that even the ones who know the numbers have only vague ideas about the trends. So I am happy to present here probably the only historic overview of IOF expense evolution from 2000 to present.
The short summary:
- IOF expenses have grown unrelentlessly since 2005, from around €200,000 to a budgeted €900,000 in 2018
- Staff cost is the dominant expense that also provided the backbone for total growth, a superb confirmation of Parkinson’s Law
- Spend on IT systems has exploded from €0 in 2013 to a planned €110,000 in 2018 – or close to 4 times what he IOF spends on quality assurance for all events in a typical year
- The Olympic project is a less visible sink for freely spendable money, but its average annual cost is comparable to all spend on IOF event quality
- Some growth is related to taking on flow through expenses (TV, AD), that were part of the sport, but now they are more visible, which is a good thing.
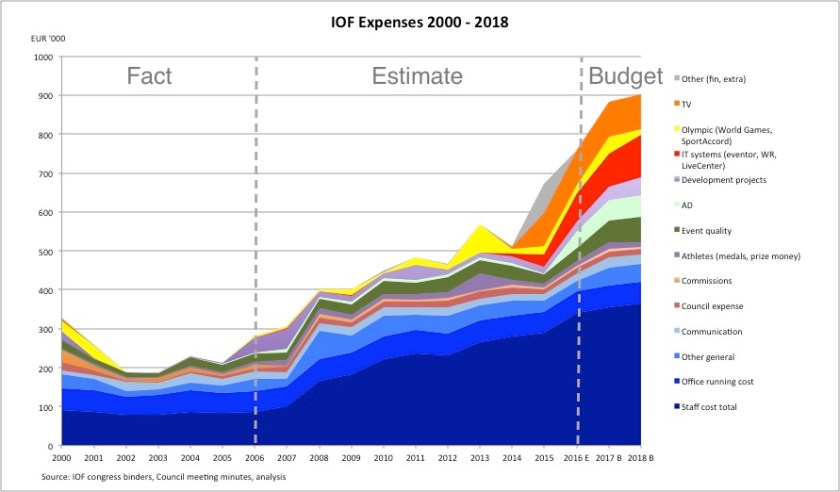
I have to admit, that it was not easy to put together the data, despite IOF being committed to the highest standards of transparency. It is bad form to complain about the difficulty of an analysis, but I have to give this caveat: post-2006 the data is mainly estimate, directionally correct, but may deviate slightly in detail. Audited reports have a different cut than relevant budget. Post-2012 60% of the expenses were on one single line “Other expenses” in the audited reports, so I had to rely on adjusted budget numbers. Where some details were given, like 2013 and 2015, they did not appear to match the totals in the audited reports, and so on.
The 2017 budget numbers were adjusted in January according to the Council meeting minutes of 2017, but not many specific details known, other than lower cost for staff (one part timer has left, but a part timer may have become full timer), and an extra €20,000 authorised for the World Games (Olympic project).
Despite all the uncertainty, the most reliable number is the ever growing total staff cost, because that was the only major expense reported on a separate line in all audited reports used. Luckily, that is also the single largest expenditure that worths attention. The other ones that exploded over the past couple years are IT systems, Olympic project, TV and Anti-Doping expenses.
Let’s have a look at these in a bit more detail.
Staff expenses
In the growth of staff expenses we may observe the forces of nature, as described by C. Northcote Parkinson in his famous book on Parkinson’s Law or The Pursuit of Progress (sadly out of print). You may read though the most relevant chapter to our discussion as a classic Economist article from 1955.
Professor Parkinson pointed out that the number of officials in public administration (that is pretty close to an international amateur sport federation funded almost exclusively by tax like fees) constantly grows irrespective whether the volume of work were to increase, diminish or disappear. The classic example presented by Professor Parkinson was the British Colonial Office that employed 372 staff in 1935 (in the heyday of the British Empire), and 1661 staff in 1954 (by the time Britain as a colonial superpower in essence ceased to exist).
So nothing to be surprised about in the growth numbers of the IOF Office. The only interesting period is the early 2000’s, when under Sue Harvey’s presidency the IOF has apparently resisted the growth prescribed by Parkinson’s Law. That period may well deserve closer investigation, though it may well be considered as pre-historic these days.
I need to mention that Professor Parkinson’s other observation was that in public administration expenditure rises to meet income. That does not appear to be valid for the IOF. We could observe that IOF expenditure has risen well above income over the past 8 years, resulting in 5 loss making years out of 8, and the erosion of 2/3 of reserves.
IT systems
Eventor, paid World Ranking, Live Center turned Live Orienteering – In 2013 €0, in 2014 €7,000, 2015 €33,000, 2016 €73,000 (with hints of additional cost overrun) and up to €110,000 budgeted for 2018.
Compare these costs to approximately €30,000 IOF spend on the quality assurance of all IOF event advising and event advisor/organiser training in a typical year. All disciplines, all regions, all ages – youth, junior, elite and master events from World Cup to various Championships. Lets call this €30,000 the EQE unit – event quality equivalent – a useful measure, considering all the difficulty to stage high quality orienteering events. So IT system expenditure has grown from 0 EQE in 2013 close to 4 EQE planned for 2018.
We will talk about these pet projects later in detail: the World Ranking that was provided for free by British enthusiasts at a good reliable quality and now cost around €16,000 a year (0.5 EQE); the Eventor system that has little use and deservedly unpopular; and the again and again rebuilt live platform with a total cost that probably nobody dared to add up.
Olympic project
This is a largely hidden sink of money. Many people I talked to were surprised about the level of spend. I include here the Sport Accord conference (around 0.5 EQE every year), and the World Games (Wroclaw 2017 – 1 EQE, Cali 2013 – estimated at 3(!) EQE).
We will discuss these as part of the broader Olympic ambitions. That would help to understand really how big waste of resources we talk about.
Anti-Doping expenses
AD looks like an expense increase (1.5 to 2 EQE), but it is only a flow through expense. It is collected in the form of special tax (Athletes’ license and A-D contribution) from athletes and organisers. There are lots of interesting questions around this topic that shall deserve several posts from AD strategy to optimal AD spend.
TV
TV looks high at 3 EQE, but this just another flow through expense – at least in good years. As discussed earlier, TV finance is risky. Cost overruns may happen easily. TV rights may not sell as expected.
Yet, taking on this risk was probably the best financial decision for the sport. Pity that not much financial cushion left to absorb this risk, if needed, after years and years of losses.
*-*-*
So now that we have the structure and basic building blocks of IOF revenue and expenditure, in the coming posts we can discuss the financial stability of the IOF, including the unfortunate, but potentially growing risk of a bankruptcy.
